
Where should the next EV charger go in Kalmar? A worked PlaceVolt Site Score example
A concrete, reproducible walk-through of how PlaceVolt turns open Swedish data into a screening signal for a public EV (electric-vehicle) charger — the regional demand read, the seven-factor Site Potential Score for a specific point, and an honest account of what the number does and does not know.
The question a site-acquisition analyst actually asks
Imagine you run charge-point expansion for a Charge-Point Operator (CPO), or you own a retail/parking property in south-east Sweden, and you have budget for one more public charger. The real question is not "is Sweden a good EV market" — it is "which town, and roughly where in it, deserves the cost of a site visit first?"
PlaceVolt answers that in two layers, both built only from open, licensed public data:
- Regional demand screening — rank Sweden's 290 municipalities (kommuner) by demonstrated EV-charging demand, so you look in the right town.
- Per-address Site Potential Score — score a specific point on seven explainable factors, so you find the under-served spot inside that town.
This article works both layers for one real place: Kalmar, the county seat of Kalmar län (region code 0880) on Sweden's south-east coast.
Layer 1 — Is Kalmar a proven-demand market?
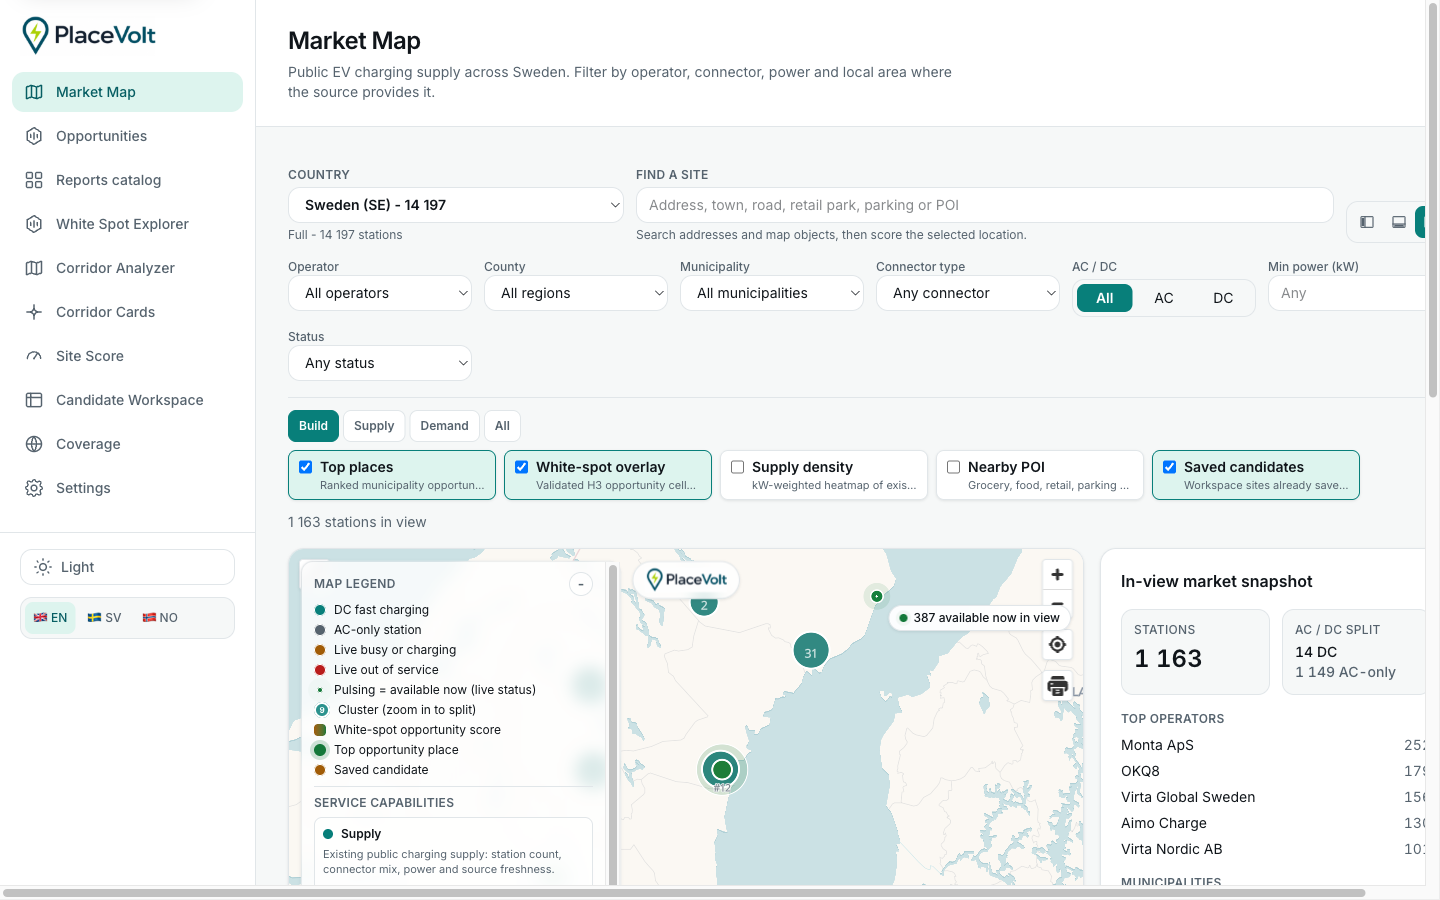
PlaceVolt's national opportunity leaderboard ranks each municipality on a demand model. For Kalmar the live open-data API returns:
| Signal (open-data proxy) | Kalmar value | What it means |
|---|---|---|
| Opportunity Score (0–100) | 84.3 | National rank #10 of 290; #1 in Kalmar län |
| Cars per 1,000 residents (SCB) | 420 | Car-dependent population — a structural EV-demand base |
| Median income (SCB) | 346.9 kSEK | 67th national percentile — above-average purchasing power |
| Public charging stations today (NOBIL) | 83 | An established charging market (96th supply percentile) |
| Nearby points of interest / dwell (density) | 257 | 88th percentile — plenty of destination dwell-time locations |
Layer 2 — Scoring a specific point in Kalmar
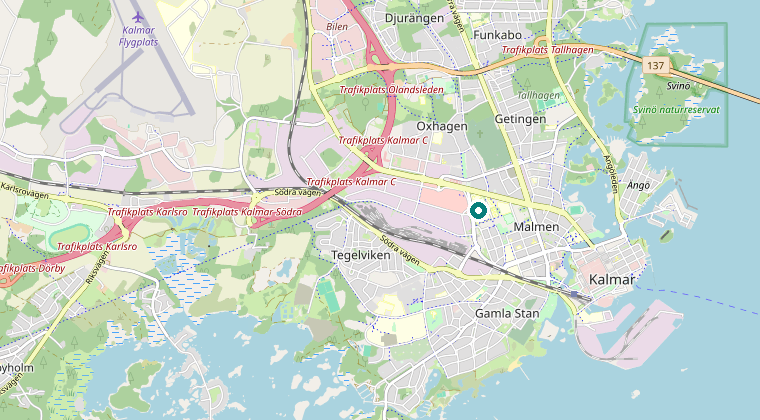
PlaceVolt derives a representative point for the municipality's opportunity — the data-weighted centre of its demand, at 56.6694° N, 16.3432° E (central Kalmar, near Malmen/Södra vägen). This is a screening centroid from open data, not a surveyed parcel: treat it as "start looking around here," then walk the streets.
Running that point through PlaceVolt's per-address model returns a Site Potential Score in the "high" band, with the seven factors weighted as below. The composite is a screening signal, so the useful read is the shape of the profile — which factors carry the point and which drag it — more than the single integer.
What each factor measures (the PlaceVolt Site Potential model)
| Factor | Weight | Open-data basis (proxy) |
|---|---|---|
| Demand | 30% | Population, cars-per-capita, EV registration trend, income (SCB) |
| Charging gap | 25% | Existing charger supply vs demand in the catchment (NOBIL) |
| Access & mobility | 15% | Road context and traffic exposure (Trafikverket, Lantmäteriet) |
| Site-type fit | 10% | Match between the location type and dwell/charging behaviour |
| Competition quality | 10% | Density, operator mix and saturation of nearby chargers (NOBIL) |
| Reliability opportunity | 5% | Room to serve where nearby supply is thin or ageing |
| Energy context | 5% | Electricity bidding-area context (Svenska kraftnät) |
At this point the model also reports the local competition it can see: about one charger within 1 km and nine within 3 km, dominant operator E.ON Energilösningar AB, and a low saturation risk — i.e. demonstrated demand without the corner already being crowded. Its confidence in the read is 0.72, and it explicitly claims no revenue or utilisation figure.
How to read this honestly
A good screening tool is one that is clear about its own limits. For this Kalmar example specifically:
- It is opportunity, not revenue. Nothing here estimates how many sessions or how much money a charger would earn. It ranks likelihood of being worth a closer look.
- The point is a centroid, not a plot. 56.6694° N, 16.3432° E is a data-weighted screening centre. The right actual parcel could be several streets away; only a site visit decides that.
- Open data is incomplete and delayed. NOBIL supply, SCB demography and Trafikverket traffic each refresh on their own cadence (some traffic counts are years old). PlaceVolt shows the freshness so you can weight it.
- It does not know the things that kill projects. Grid-connection capacity and cost, land control, permits, and private utilisation data are all outside the score and must be checked before any decision.
- The regional model rewards proven demand. If your strategy is deliberately greenfield (build where no one has yet), weight Layer 2's charging-gap factor higher than Layer 1's ranking.
Reproduce every number yourself
None of this is a black box. The two API calls below return the exact figures used above:
# Layer 1 — Kalmar's regional opportunity row (live open data)
curl -s "https://api.placevolt.com/api/signal-sites/0880"

# Layer 2 — per-address screening pass at the representative point
curl -s -X POST "https://api.placevolt.com/api/site-score" \
  -H "content-type: application/json" \
  -d '{"latitude":56.6694,"longitude":16.3432,"site_type":"retail"}'
The full source registry, licences and refresh dates are on the app's coverage & sources pages.
Score your own site in Kalmar — or anywhere in Sweden
Check a single address free, no account needed. Unlock the full report — breakdown, competition and sources — when it's worth it. For CPOs, investors and EPC (engineering-procurement-construction) teams, the 3-site pilot audit screens a shortlist before you spend on feasibility studies.
Data sources & attribution
This example uses open, licensed public data only, processed by PlaceVolt:
- NOBIL / Swedish Energy Agency (Energimyndigheten) — public charging-station locations and status (CC BY 4.0).
- Statistics Sweden (SCB) — population, cars per capita, income (CC0).
- Lantmäteriet — geodata (CC0).
- Trafikverket — road and traffic context.
- Svenska kraftnät — electricity bidding-area context.
- Base map in Figure 3 © OpenStreetMap contributors.
Scores are derived from open-data proxies and should be validated with site feasibility, grid connection, permits and private utilisation data before investment decisions. This is a potential/opportunity score, not a revenue forecast.